
You’re asking what the gold market is doing and where it’s headed. You’re in the right place. Gold is more than just a metal. It’s a safe-haven asset for many during uncertain economic times.
This gold market analysis today gives you a clear look at the current gold price trend. We’ll break down the key factors moving the price, what the charts are telling us, and what you should watch for in the gold market forecast. Let’s get started.
How has the gold price moved recently, and what should investors know?
Gold prices have experienced an unprecedented surge to historic highs in 2025, driven by inflation concerns and geopolitical tensions. Recently, the price saw a sharp correction, illustrating the market’s volatility. Investors should closely monitor economic indicators and geopolitical developments as the gold market balances between opportunity and risk.
What is the Gold Price Live Today?
The gold price today in USD is showing a lot of activity. If you’re asking “how much is 1 oz of gold going for today?” the exact number changes by the second. For the live, up-to-the-minute price, you should always check a real-time chart.
What’s important for our analysis is the trend. Today, the market has been testing key price levels. We’ve seen some volatility this morning as traders react to new economic data. These small shifts in the gold price per ounce can point to bigger market feelings. Watching these live changes helps you understand the market’s mood.
We have a real-time chart on our Gold Rate Tool page that shows you the exact price as it moves.
What Factors Are Influencing Gold Prices Today?
The gold price doesn’t move in a vacuum. It reacts to multiple complex factors. If you wonder why gold prices rise or fall, these are the key influences today:
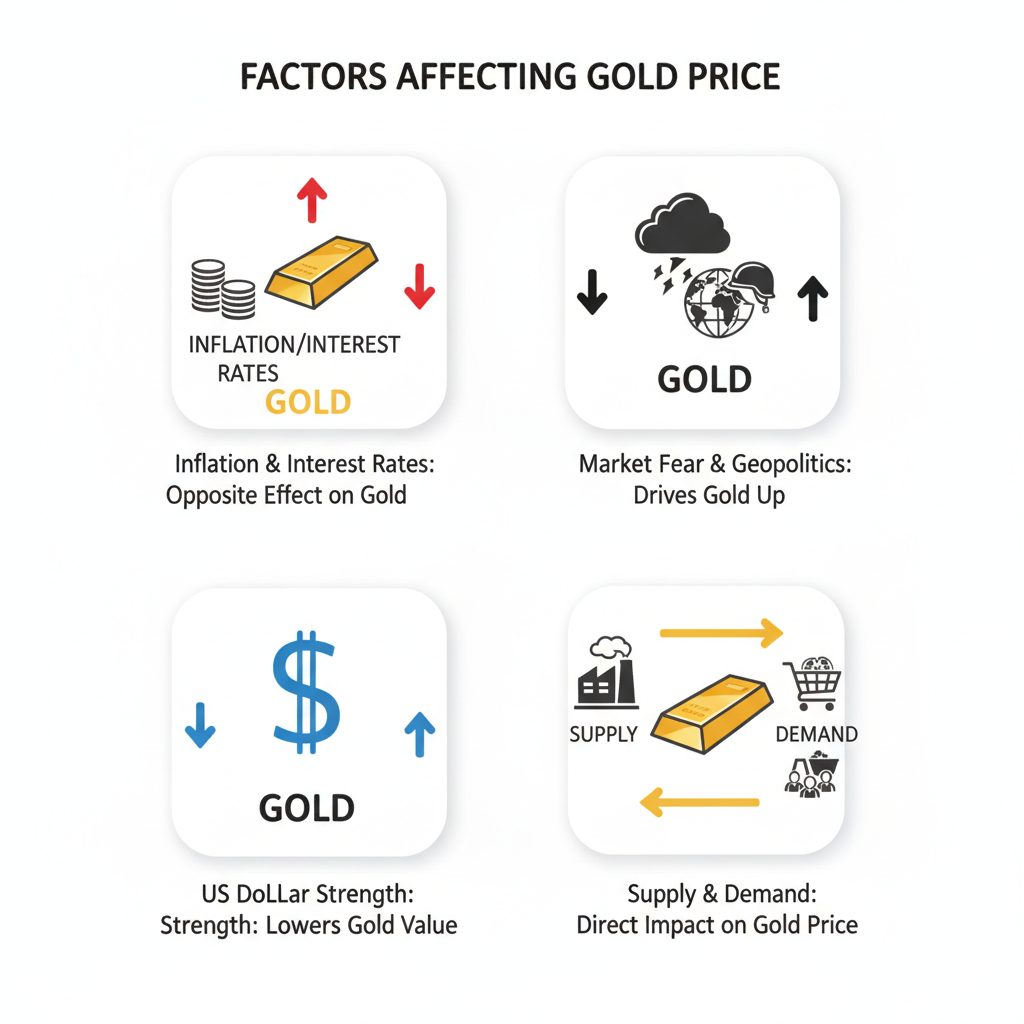
- Inflation and Interest Rates: High inflation usually drives investors to gold to protect wealth. But rising interest rates by central banks can make bonds and savings more attractive, diverting money from gold.
- Market Fear and Geopolitical Events: Gold is a safe-haven asset. During stock market crashes or geopolitical conflicts, demand for gold as a stable asset increases significantly.
- The U.S. Dollar: Gold is priced in dollars, so when the dollar strengthens, gold prices usually fall, and vice versa. Recently, the dollar’s strength caused a sharp pullback in gold prices after record highs.
- Supply and Demand: Central banks and consumers in key markets like China and India influence prices based on their buying. Physical demand has remained robust in 2025.
- Recent Volatility and Historic Moves: In 2025, gold prices surged to record levels above $4,100 per ounce but experienced an extraordinary correction soon after—one of the most volatile periods in decades. This reflects a delicate balance of investor sentiment, economic policy shifts, and market dynamics, making the gold market highly sensitive today.
Gold Technical Analysis: Is the Market Bullish or Bearish?
Now let’s look at what the charts are telling us. Gold technical analysis helps us read the story of the price. It shows us whether the market is in an uptrend or a downtrend.
Right now, the gold price trend is showing a struggle between buyers (bulls) and sellers (bears). You can see this on our Advanced Gold Chart. Traders are watching a few key signals to figure out how gold prices will move today.
1. Moving Averages (MA)
The moving average lines on the chart help smooth out the price to show the real trend. If the gold price is trading above its 50-day moving average, that’s often seen as a bullish sign. If it’s trading below, it could point to a bearish trend.
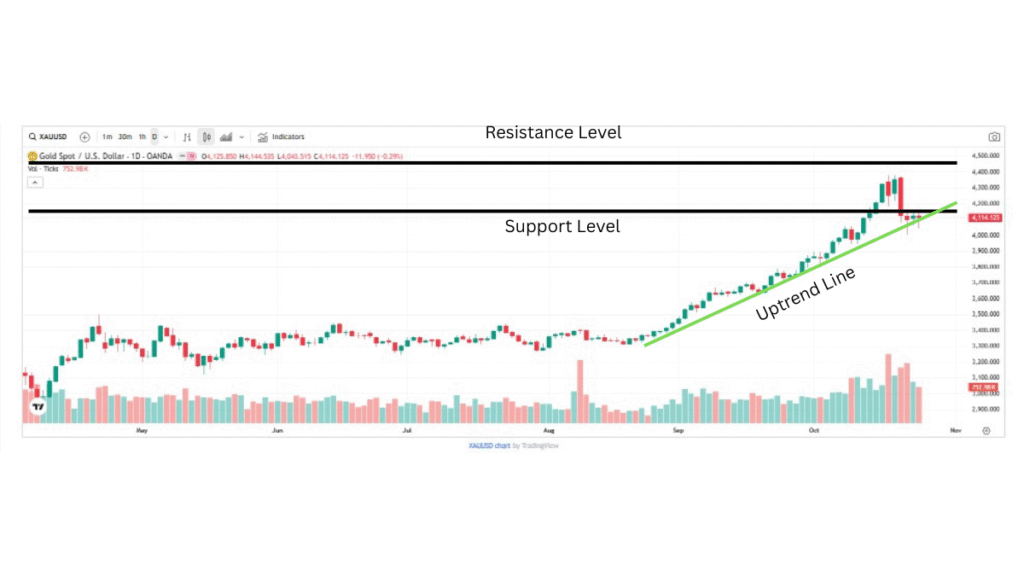
2. Support and Resistance Levels
These are important price “zones”. Support is a price level where buyers tend to step in and stop the price from falling further. Resistance is a level where sellers often take profits, creating a price ceiling. From the chart, we can see the market is currently finding support near the $4,100 level. A strong break below this could signal further downside, while holding this level could be a sign that buyers are still in control.
3. RSI (Relative Strength Index)
The RSI indicator measures market momentum. A reading above 70 suggests gold might be “overbought” and could be due for a pullback. A reading below 30 suggests it might be “oversold” and could be a good time to buy.
So, is gold bullish or bearish? The technicals suggest a mixed picture today. While the long-term trend has been strong, the short-term indicators show a pause. The market is waiting for a clear signal to make its next big move.
Gold Investment Analysis: Is It a Good Time to Buy?
This is the big question. Your gold investment analysis depends entirely on your personal goals and how you see the market. There’s no single right answer, but here are some common approaches.
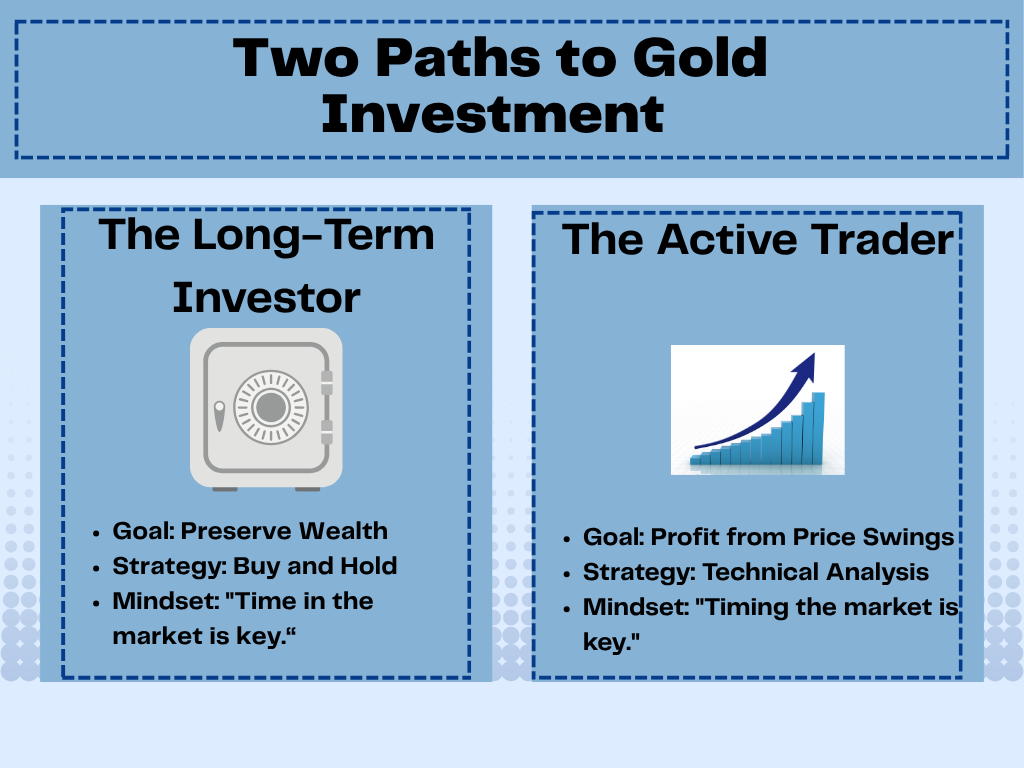
1. Gold as a Long-Term Hold
Many people buy gold not to get rich quick, but to preserve their wealth. They see it as a form of financial insurance. For these investors, short-term price drops are seen as buying opportunities. If you are asking “what will gold be worth in 5 years?”, the historical trend has been upward. The core strategy here is to accumulate physical gold or a gold ETF over time and hold it.
2. Gold as a Strategic Trade
Traders, on the other hand, look for short-term opportunities. They use the gold technical analysis we talked about to decide when to enter and exit. For them, “is it the right time to buy gold?” depends on the signals. A trader might wait for the price to bounce off a support level or break through a resistance level before making a move.
What are the best strategies for gold investment today?
- For the cautious investor: Dollar-cost averaging (buying a fixed dollar amount of gold regularly) can be a smart way to build a position without trying to time the market perfectly.
- For the active trader: Using the tools on our Advanced Gold Chart to set clear entry and exit points is key. Don’t trade on emotion.
The key takeaway is to know what kind of investor you are. Are you in it for the long haul or looking for a short-term trade? Your answer will guide your strategy.
Conclusion: Today’s Gold Market Outlook
So, what’s the gold market forecast? The picture today is complex. The long-term global gold market outlook remains strong, with support from central bank buying and ongoing economic uncertainty. These are powerful gold demand trends in 2025 to watch.
However, the short-term is a tug-of-war. The price is reacting to interest rate news and the strength of the U.S. dollar.
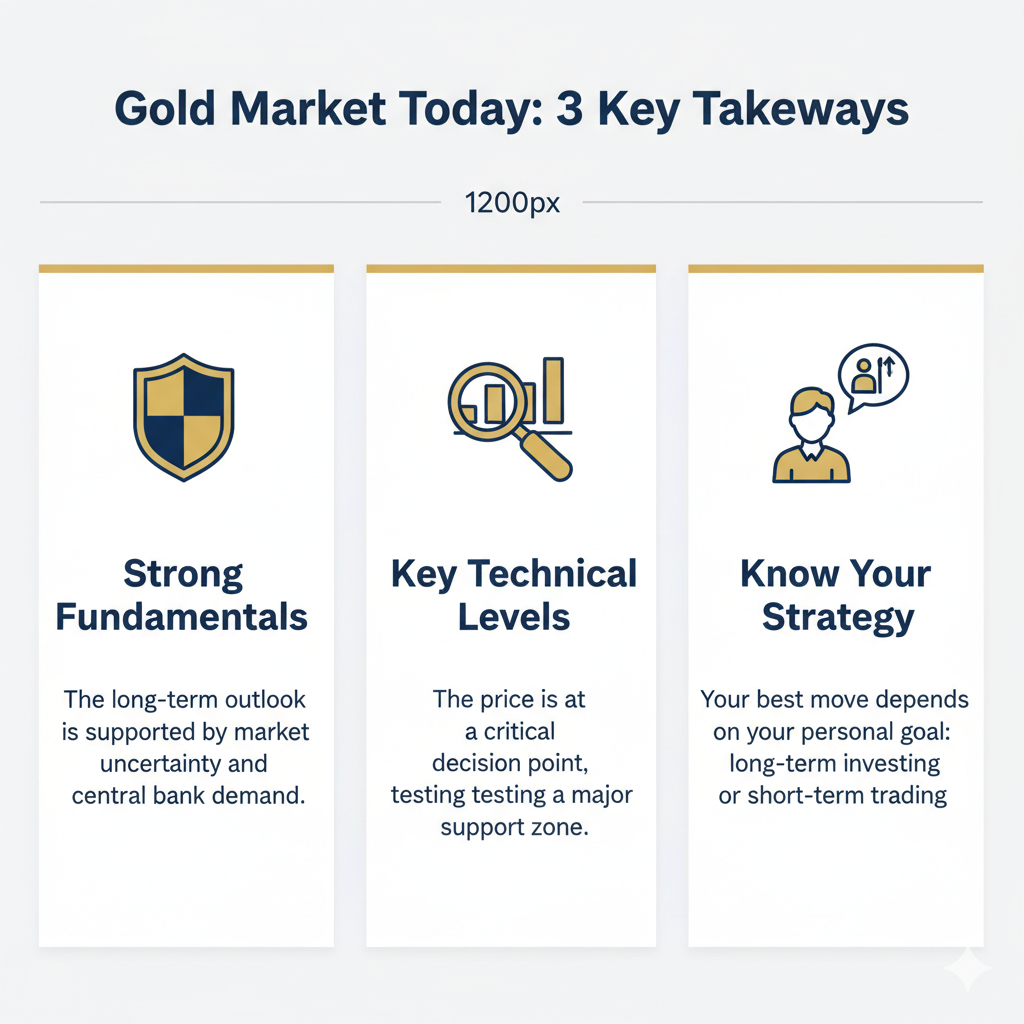
Here are the key today’s gold market trends and insights:
- The Big Picture: The fundamental reasons to own gold, like hedging against inflation and market risk, are still very much in play.
- The Technical View: The price is at a decision point, testing key support levels. A clear break in either direction will likely signal the next short-term trend.
- Your Strategy Matters: The “right” move depends on your goals. Long-term investors may see current prices as a solid entry point, while short-term traders should wait for clear confirmation from the charts.
The best advice is to stay informed. Keep an eye on the economic news and use the tools available to you. The gold market offers opportunities, but making smart decisions requires a clear head and good information.
Explore All Our Free Tools & Guides
Our Online Tools
- Word and Character Counter
- Case Converter
- Random Number Generator
- Lorem Ipsum Generator
- Percentage Calculator
- Live Gold Price
- Advanced Gold Chart